Inventory XYZ Analysis Report
Inventory XYZ Demand Variation Report odoo app helps users to identify product stock in three classes X, Y and Z. Users can see XYZ analysis reports, generate excel reports and view graphs and pie charts for XYZ reports. Here are the classification details for different classes.
X Items: X items products considered in very little demand variation.
Y Items: Y items products considered in fluctuating demand.
Z Items: Z items products considered in highest demand variations.
Features
1) Stock XYZ Analysis Report
User can check fast moving, slow moving and non moving product for stock.
2) Stock XYZ XLS Report
User can also print XYZ analysis report in XLS format.
3) Different Filters for XYZ Report
User can use different filters like product and product category, date start, date end and company for XYZ report.
4) Current Stock & Coefficient Variation % for Stock
User can see current stock and coefficient of variation percentage for stock.
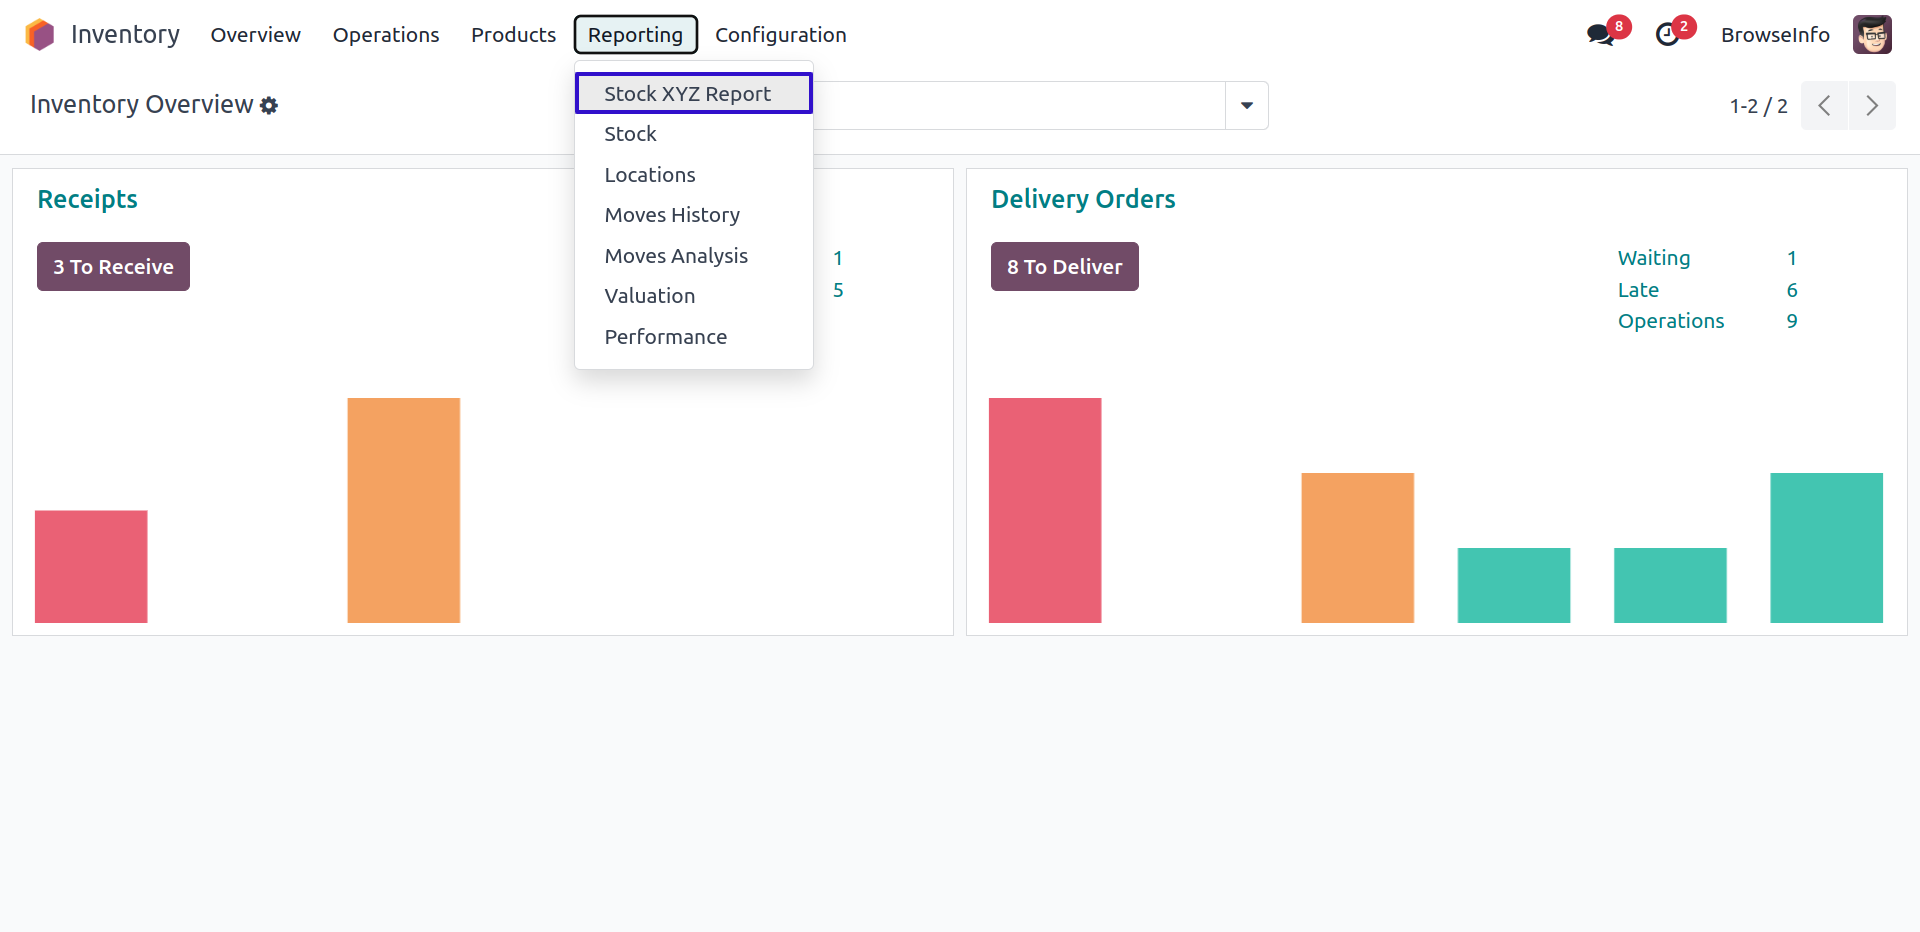
Stock XYZ Report Menu
Under Inventory > Reporting menu user can see "Stock XYZ Report" menu.
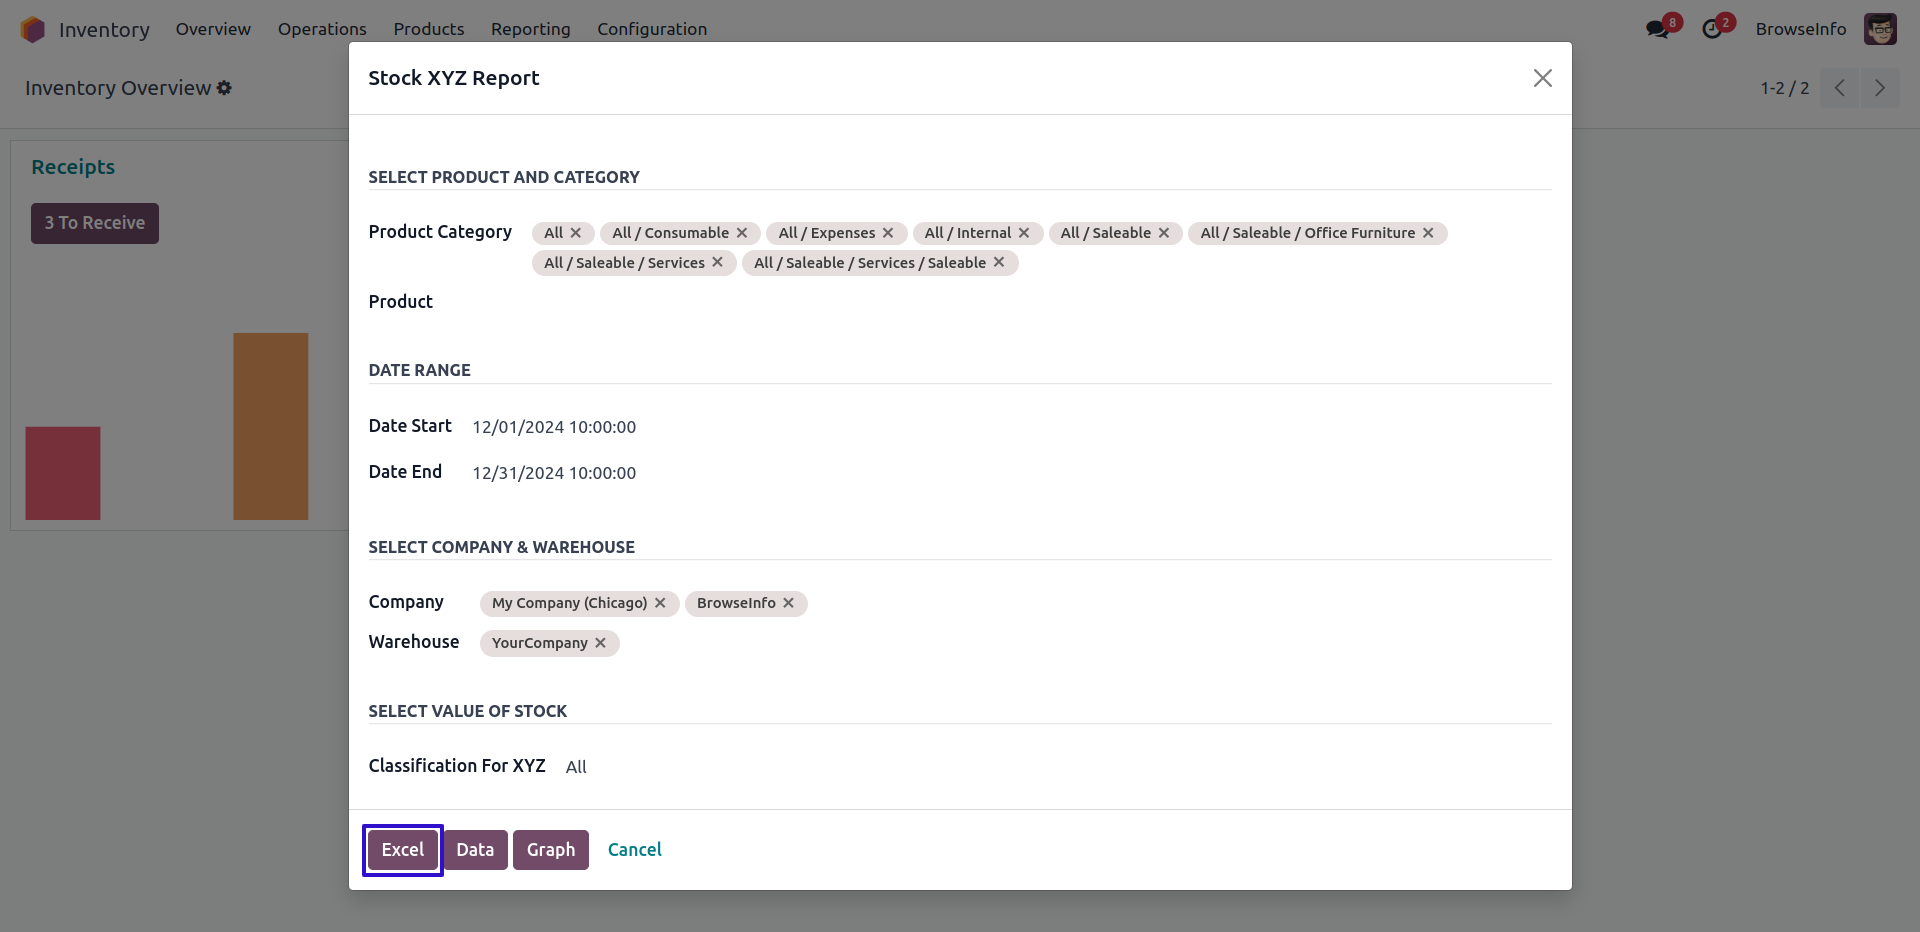
On clicking menu new wizard will open user can apply different filters like product categories, products, date start, date end and company, Also can select different XYZ classification type.
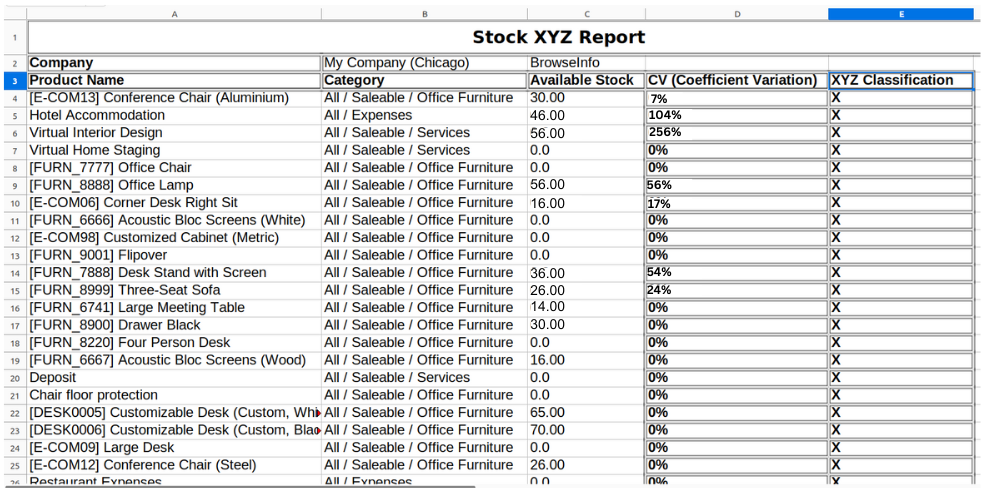
Stock XYZ Excel Report
On clicking the "EXCEL REPORT" button user can see generated XYZ excel report as below the image.
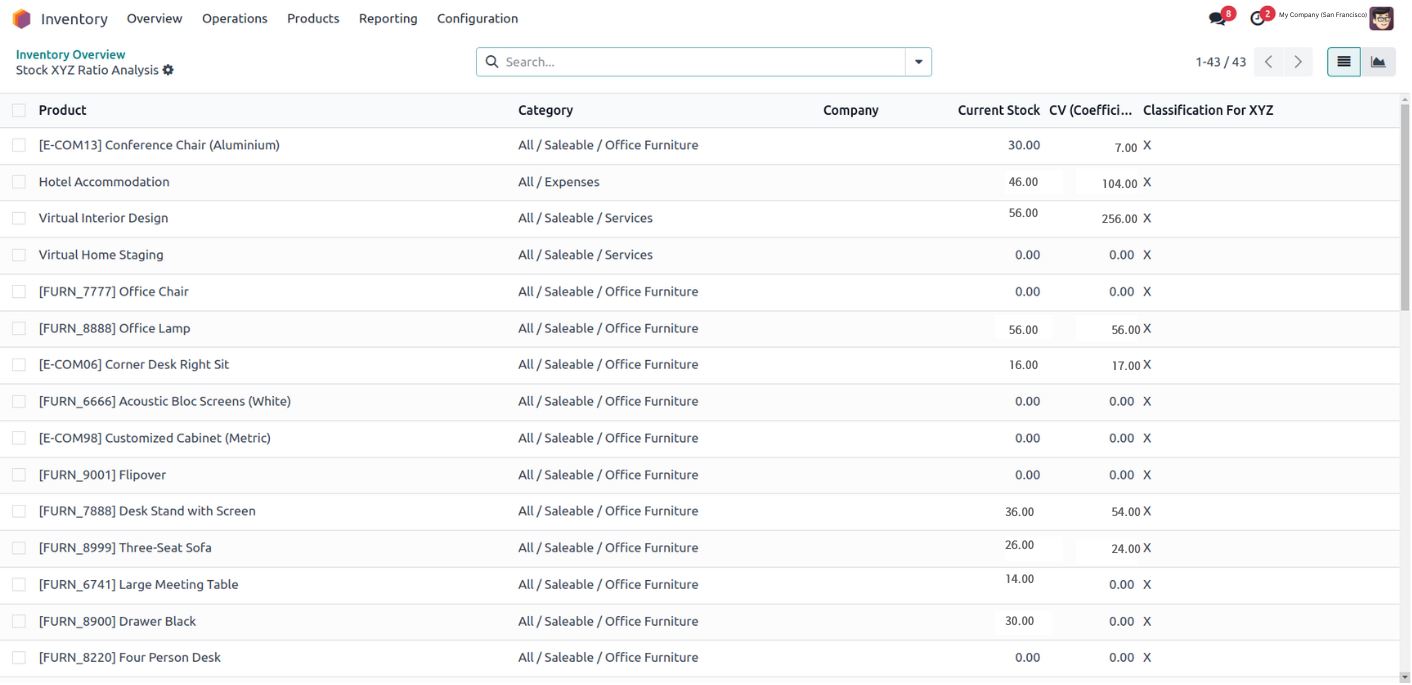
Stock XYZ Analysis Report
On clicking "VIEW DATA" button user can see XYZ analysis report.
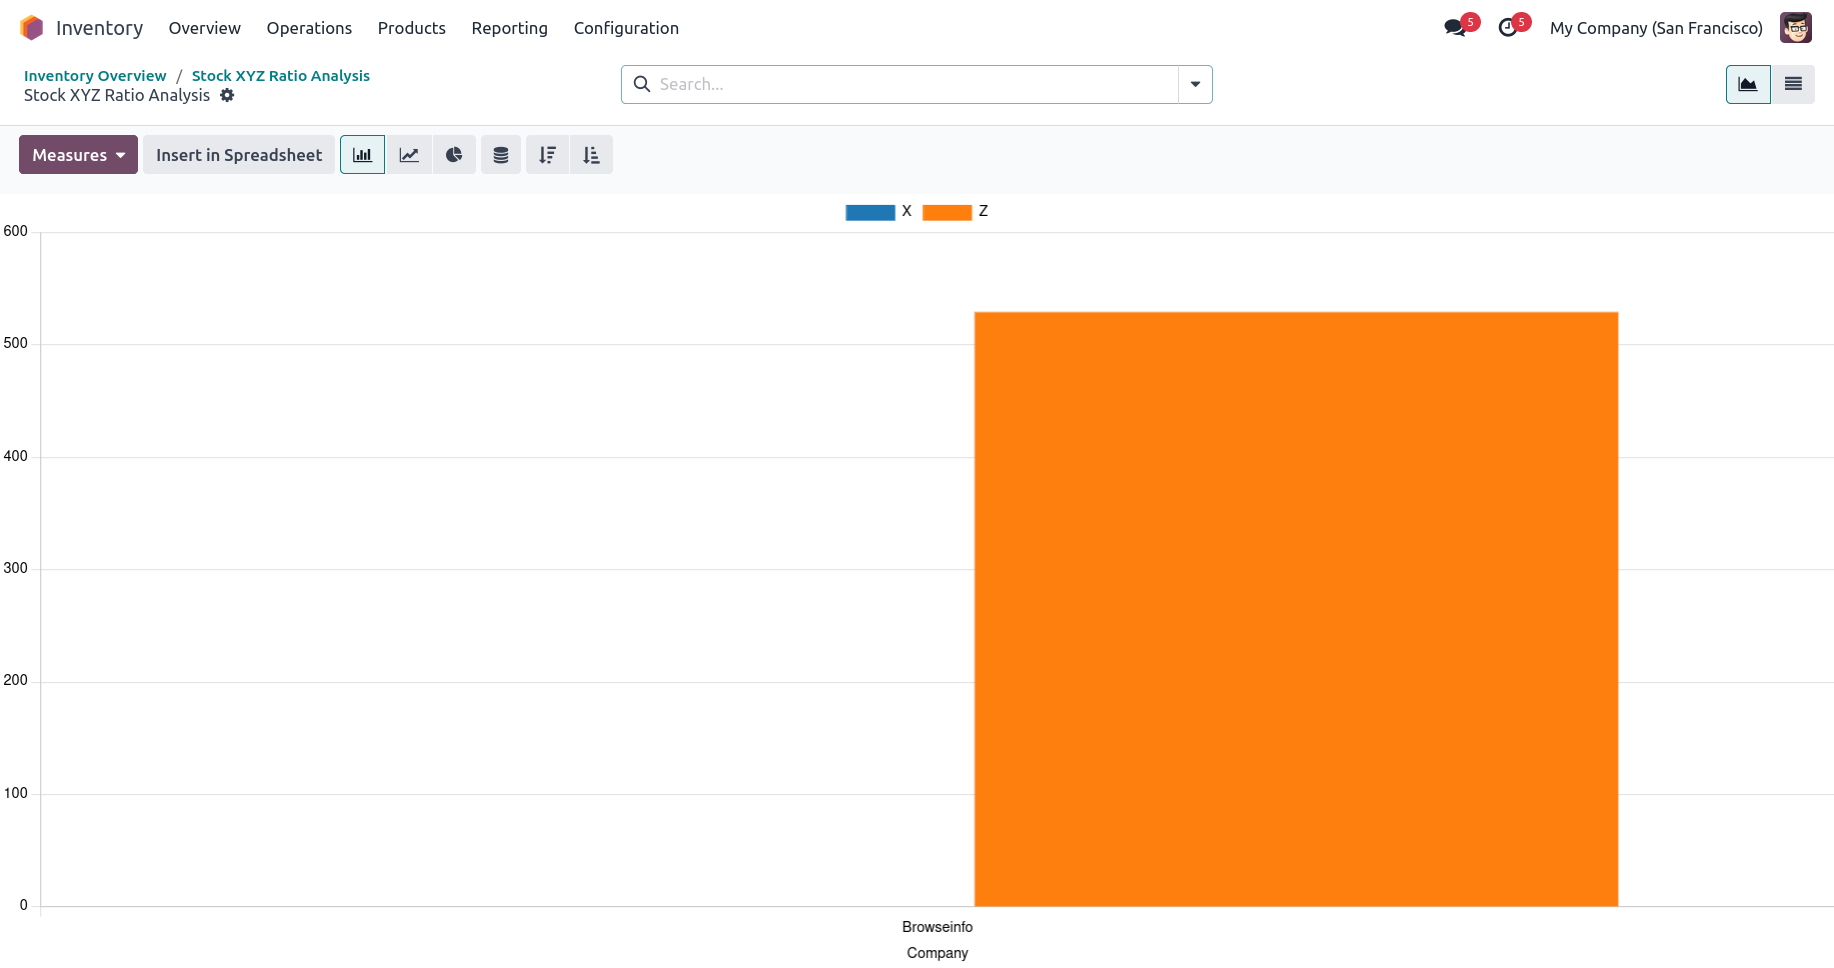
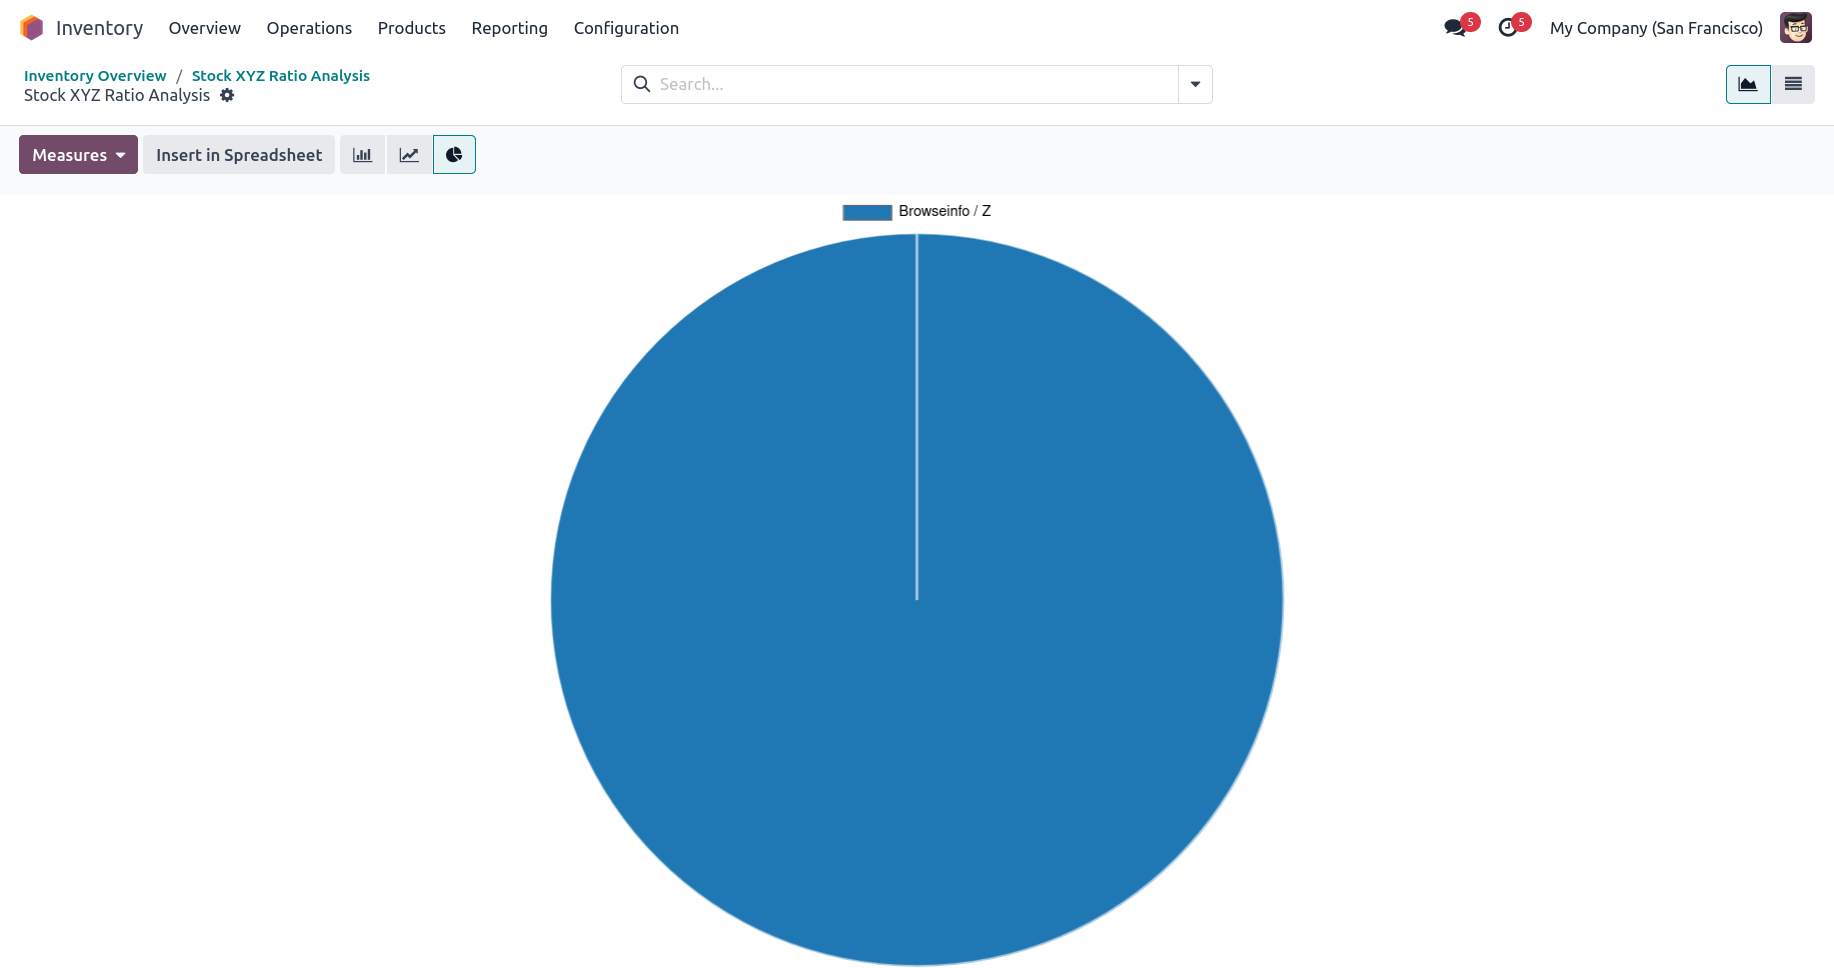
Stock XYZ Graph Report
On clicking "VIEW GRAPH" button user can see graph view for XYZ analysis.